3DCS Variation Analyst

ซอฟต์แวร์วิเคราะห์ความคลาดเคลื่อนที่ใช้มากที่สุดในโลก
3DCS ซอฟต์แวร์วิเคราะห์ความคลาดเคลื่อนที่ใช้มากที่สุดในโลก
Product type : Engineering Solutions
3DCS Variation Analyst is the world’s most used tolerance analysis software that is fully integrated into Siemens NX / CATIA V5/ PTC Creo /SOLIDWORKS and CAD Neutral MultiCAD.
It enables designers and engineers to define, test, and modify dimensional product and process requirements in a NX / CATIA V5/ PTC Creo /SOLIDWORKS digital environment before processing. 3DCS Variation Analyst enables manufacturers to quickly evaluate GD&T, assembly tools, and assembly sequences before launching production to fully estimate design, manufacturing, and assembly robustness. Making full use of 3DCS tolerance analysis can reduce the development cost of new products that are quickly brought to market and improve the performance of existing manufactured products.
To put it simply: 3DCS assists designers in clearly predicting the Cpk of important product measurement targets during the design phase, analysing and optimizing product portfolio tolerances.

PREDICT THE
assembly variation of manufactured products with virtual prototypes
RESPOND
to specific contributors of cumulative variation for optimizing designs
CONTROL
costs and dimensional integrity with proactive variation analysis
BENEFITS
- Test, optimize and improve your GD&T (Geometric Dimensioning and Tolerancing).
- Determine optimum Gap and Flush conditions based on your manufacturing processes.
- Simulate your manufacturing and assembly processes to determine optimum methods and order.
- Reduce overall variation about compensating for it in design.
- Through robust design and GD&T, reduce the need for scrap and rework.
- Use measurement data from the plant to resolve production issues with the CAD model.

ANALYST
3DCS Variation Analyst (Siemens NX / CATIA V5/ PTC Creo /SOLIDWORKS based) it is an integrated solution, users can not only activate 3DCS workbenches from within the modelling solution, they can use many of its inbuilt functionality to support their modelling.
3DCS Variation Analyst Multi-CAD is a standalone CAD neutral software system. It is used for modelling variation that is caused by part tolerances as well as manufacturing and assembly
processes. Using Transmagic conversion software, 3DCS Multi-CAD works with native CAD files (.prt, CAD product, etc), STEP, IGES and JT files.
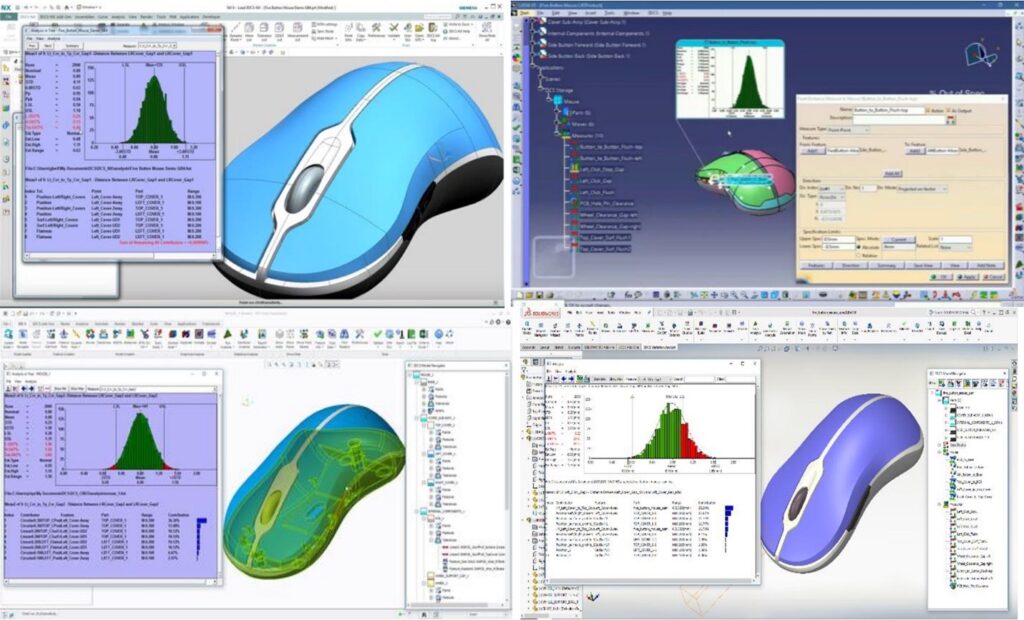

The basic conditions required to perform a complete 3DCS tolerance analysis are :
- The basic digital model of the part
- Part positioning system
- Part tolerance information
- Assembly system of parts
- Analyze the target
Analysis Methods of 3DCS Variation Analyst
- Monte Carlo Analysis:
Works by simulating thousands of builds using virtual components and gathering information for each build. The simulation varies randomly tolerances to all components within specified ranges, assembles the components as described in the build sequence and then measures the required outputs - High-Low-Mean (Sensitivity
Analysis)Determines which tolerances have the largest contribution per measurement - GeoFactor Analysis (Relationship)
Analysis examines the contribution of the tolerance based on geometry effect
Analytical output of 3DCS Variation Analyst
- GD&T analysis: validate the GD&T of the parts, then make adjustments to optimize for cost, quality and control.
- Objectives analysis: Determine the visual impact of variation stack-ups on the appearance of the parts.
- Contributors analysis: A comprehensive analysis of the factors affecting the design goals.
Features
- Perform What-If Analysis
Learn the impact on the final assemblies before costly design changes are made - Reuse Models
Capture commonly used processes and build your own library of easily accessible models - Update Models Automatically
Direct links to design geometry result in quick and efficient tolerance model updates - Use Manufacturing Data
Import real world data into 3DCS Analyst for root cause analysis to improve existing build processes - Identify Contributors
Locate tolerances and assembly processes responsible for variation - Animate Build Sequences
Create exploded views and display parts moving sequentially to their final assembled positions - Animate Variation On-Screen
Users can visualize clearances & interferences on solid geometry or through a section by sweeping parts and assemblies within their statistical extremes - Create Models Without Geometry
Perform tolerance analysis with 3DCS Analyst before CAD geometry exists
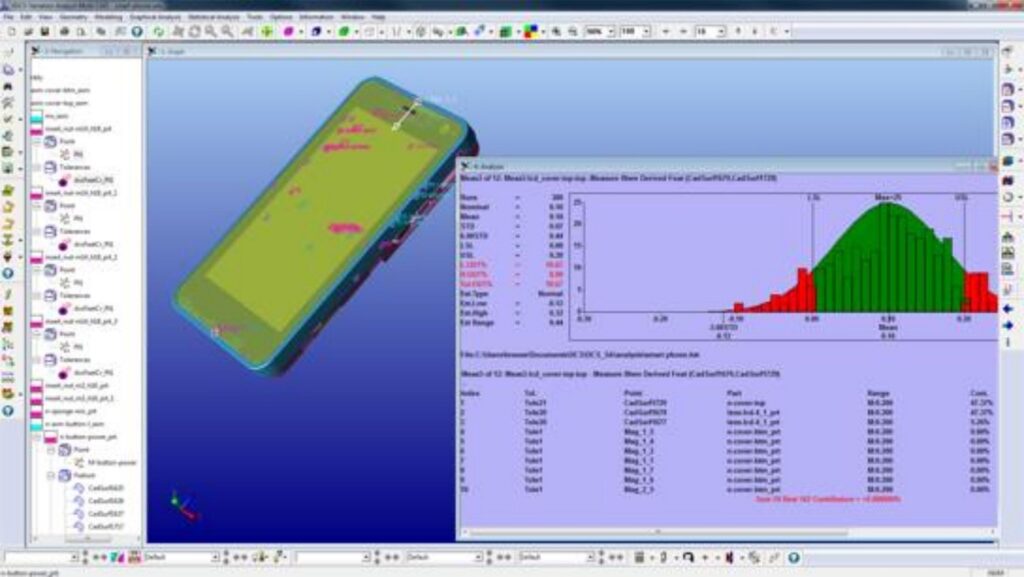
ADVANCED ANALYSIS AND OPTIMIZATION
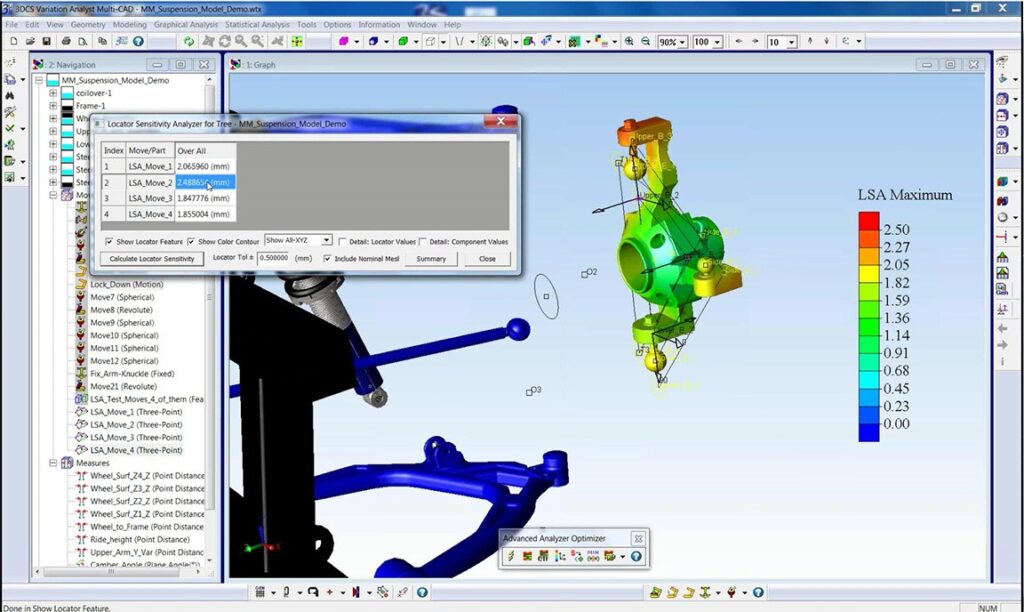
Advanced Analysis and Optimization (3DCS AAO) is an add-on module to 3DCS that uses and extends current Geofactor-based equations and combines coefficients generated from Geofactor or DOF (design experience) to support non- Linear model.
It able to test datums and locators, view matrices to work with large models and tackle non-linear tolerance stacks. Before using the module, a complete 3DCS model must be built to function properly.
It includes two core functions:
- 3DCS Analyzer (3DCS Advanced Analyzer): An equation-based analysis method that accurately identifies the number of changes and sources of variation in an assembly.
- 3DCS Optimizer: A tool that optimizes tolerances to ensure quality at the lowest cost or at the lowest cost.
Tolerance Analysis Tools
- Advanced Analyzer Matrix
display all of your tolerances or measurements in a single matrix to quickly view outputs, statistics and make changes globally. - Critical Tolerance Identifier
Find the most critical tolerances in your model or the most critical part in your assembly that adds the greatest variation. - Tolerance Optimizer
Optimize your tolerances instantly to meets specified criteria, loosening non-critical areas and tightening critical ones. - Locator Sensitivity Analyzer
Test and validate your locators. Create different locating patterns and simulate to find the pattern that results in the least variation.

MECHANICAL MODELER
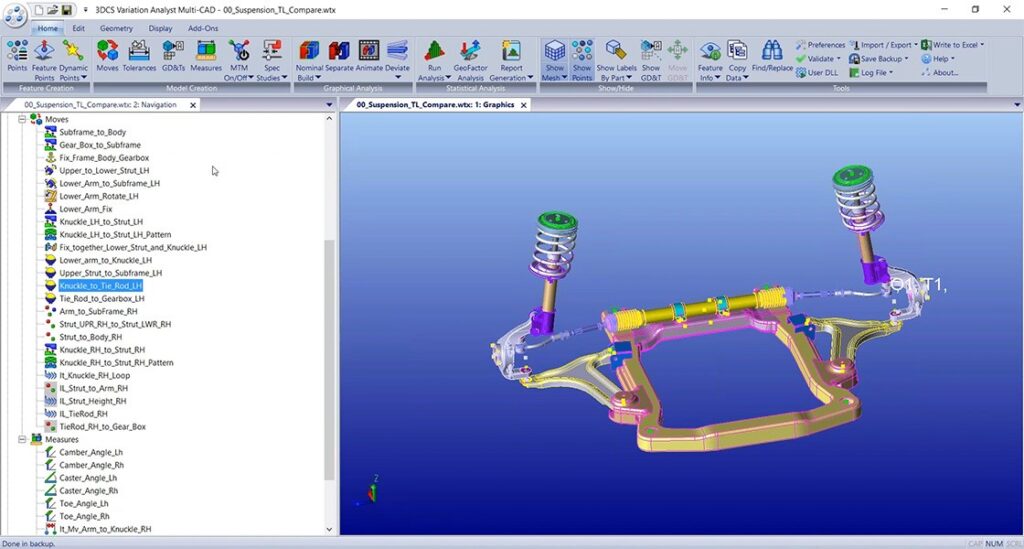
3DCS Mechanical Modeler (3DCS MM) is an add-on module for 3DCS software solutions which can determine the impact of variation on your assembly through its entire range of motion. It able to add kinematic functions, joints and constraints and linkages for mechanical assemblies.
Features of 3DCS MM
- Add new Joints and Constraints to the model by using the library of Joints and Constraints in 3DCS Mechanical Modeler. For example, a 3-link connection can be modelled using three rotating sub-assemblies
- Extracting Joints and Constraints from CAD and applying them to your DCS model instructs the software on the build and assembly process of your product
- Validate Your Joints and Constraints from CAD by using the Degree of Freedom Counter
- Solve Over Constrained Parts and Assemblies
- Support for multiple sub-assemblies.
- Component moves in a certain range of motion in the direction of unconstrained degrees of freedom
- Can calculate simulation results at multiple motion positions
Supported Joints & Constraints
Joints:
- Spherical
- Revolute
- Prismatic
- Cylindrical
- Planar
Constraints:
- Fixed
- Coincidence
- Contact
- Offset
- Angle
- Fix together
COMPLIANT MODELER
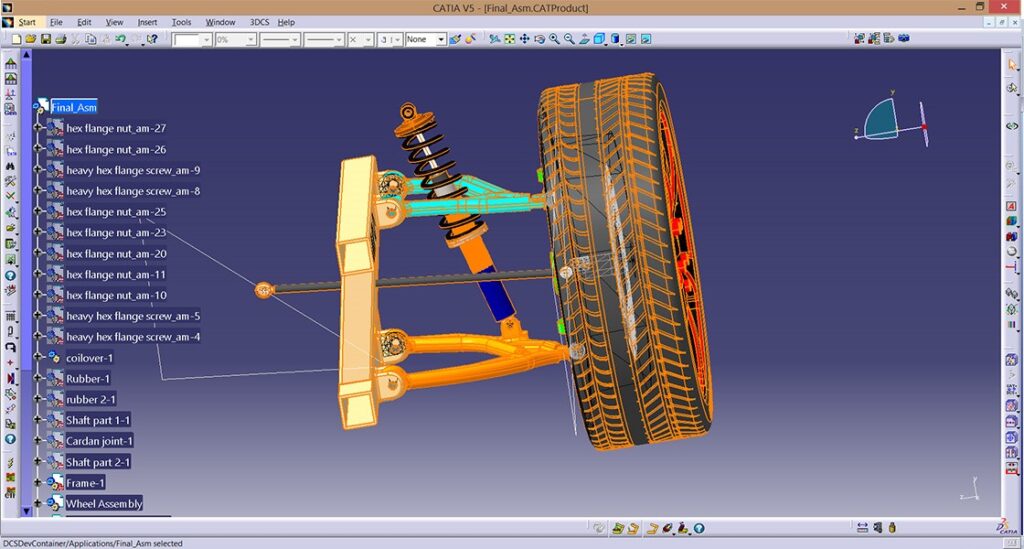
3DCS FEA Compliant Modeler (3DCS FEA CM) is an add-on module for 3DCS software solutions. The 3DCS FEA CM simulates dimensional changes in part deformation, which may be caused by springback, gravity, or manufacturing/assembly production operations (clamping, loosening, welding, tightening, force, etc.).

Features of 3DCS FEA CM:
- Provide high quality, realistic graphics to show the deformation of components
- Support a large number of finite element analysis before and after processors
- Multi-station deviation analysis
- Target mode for advanced design evaluation
- Apply Clamping and Welding
- Test Manufacturing processes and simulated on products before going to production
- Compare Order of Operations to find the optimal locations of welds, rivets or clamps
- Determine the impact of thermal effects from the environment or function
GEOFACTOR ANALYZER ADD-ON MODULE
Determine how the Geometry of your product affects your tolerances
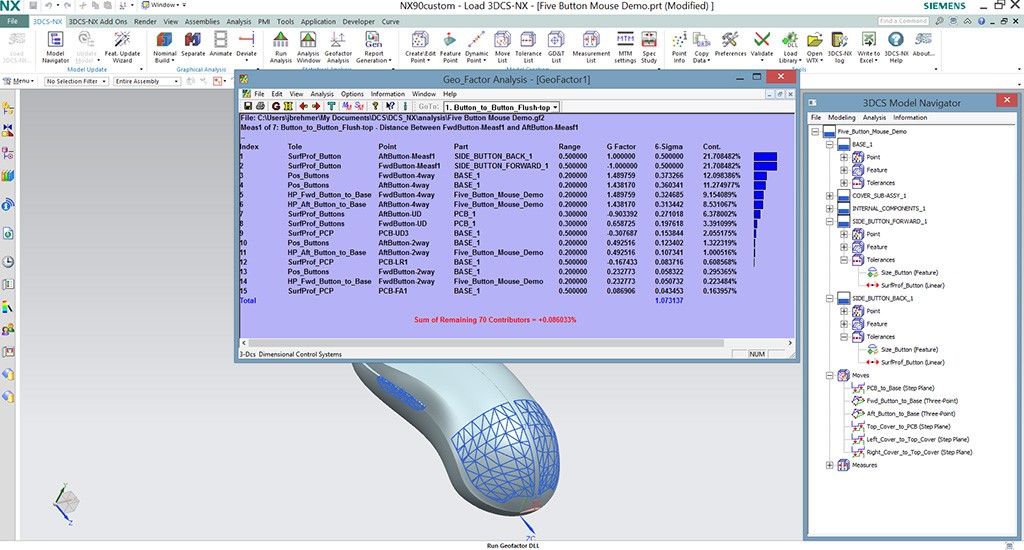
3DCS Geofactor Analyzer determines the sensitivity of tolerances to change. This geometric relationship is displayed as a factor, called a GeoFactor, which is a multiplier to the tolerance based on its influence in the overall assembly.


GeoFactor Analysis
Determine geometric relationships between parts:
- Determine the multiplicative effect of variation on your tolerance changes
- Determine which tolerances contribute the most variation
- Identify critical tolerances
- Determine how changing specific tolerances will affect the overall variation
Tolerance Relationships are Not Always 1 to 1
Determine Whether Your Geometry Amplifies or Mitigates Your Tolerances
GeoFactor Analyzer adds to your analysis results by determing the GeoFactor for each tolerance.
Key Benefits:
- How does changing a tolerance affect overall variation – If you tighten or loosen a tolerance, how much will actually affect your assembly?
- How does the geometry of your product affect the influence of your specific tolerances – How does the assembly process and build affect the influence of your tolerances?
As part of the HLM Sensitivity Analysis, GeoFactor improves your overall understanding of the model, giving a value for the sensitivity of each tolerance, whether it is amplified or mitigated by your product geometry.
Geometric Relationship Between Parts
Determine how your components relate
View the geometric effect of your tolerances. Based off of the geometry, determine how much the geometry amplifies or mitigates your tolerances.
Benefits:
- GeoFactor greater than one amplifies a tolerance
- GeoFactor less than one mitigates a tolerance
- One part of the HLM Sensitivity results
Use Geofactor Results with AAO
Use the Geofactor Table to see Geometric Factors across your entire model
View all Geofactors in your model in one window. Update your model information and see the effects instantly.
VISUALIZATION EXPORT
Improve Your Product’s Perceived Quality Through Visualization Studies in Leading Tools: Deltagen, CATIA 3DEXPERIENCE, Keyshot, Design Studio and More
Perceived Quality is the quality attributed to a product based on its perceptual experience. This incorporates the experience a customer has with a product and how it makes them feel about that product.
Bringing together the shape, the appearance, the texture, and physical feel of the product as well as the emotional experience of using the product, Perceived Quality directly affects the opinion of the value of the product. This perceived value then drives the business forward.
Visualization Export gives engineers the ability to view simulations of their final product’s variation to make decisions about design early in the Product Life Cycle that will ultimately affect their customers’ Perceived Quality of the product.
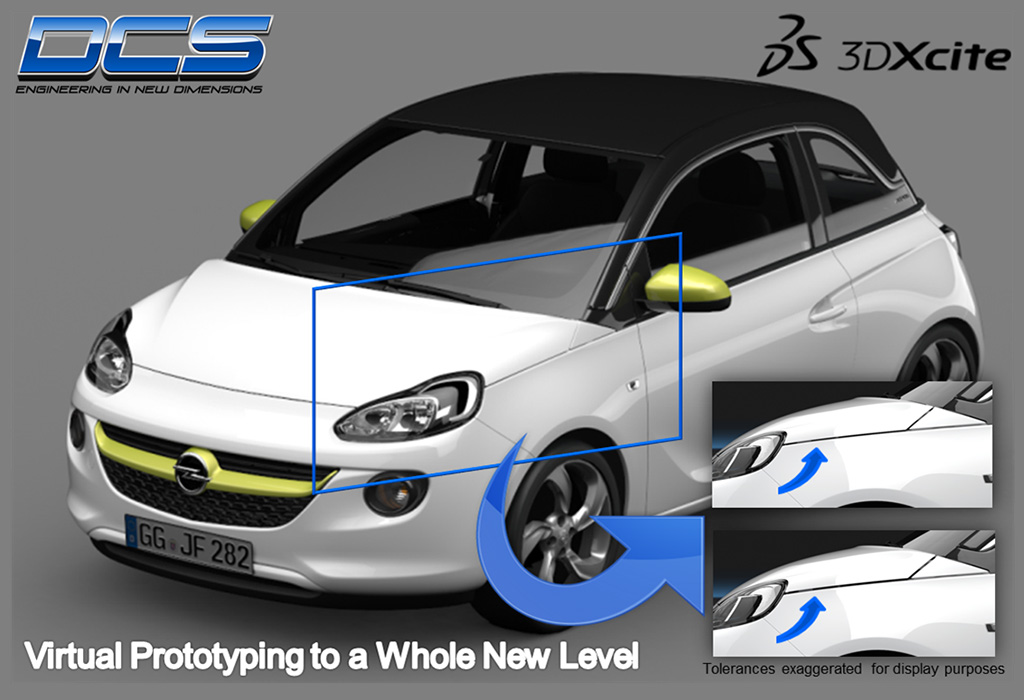


Improve Customer Perceptions
Use visualization tools with Tolerance Analysis to determine the impact of variation on your final product:
- Experience the Design Impact
- Predict the probability of variation scenarios
- Create virtual prototypes to see design changes
- Validate both design and engineering
Make Early Design Decisions Based on Virtual Prototypes
Reduce the need for physical prototypes through Visualization
Perceived Quality Studies are a means of communicating quality objectives and attainable quality levels between Design and Engineering teams. This process incorporates iterative studies to determine acceptable aesthetic levels and then confirms manufacturing’s ability to meet those objectives.
Steps in a Perceived Quality driven PLM Cycle:
- Design Spec Studies and Visualization
- Review Specifications (ex. Gap and Flush) and Determine Objectives
- Create Tolerance Analysis Models and run Monte Carlo Simulations
- Share and Approve/Reject Results
Perceived Quality Studies can be used to target specific Gap and Flush conditions to see how variation will affect the appearance of the product. Hood to Fender gaps, rear view mirrors, displays on cameras, panels on consumer goods, seats on snow mobiles. Every product benefits from Perceived Quality Studies.
Design Spec Studies and Visualization
Create Early Studies
Before getting any manufacturing tolerances, use SPEC STUDIES to set Gap and Flush conditions to determine maximum and minimum acceptable levels.
Process:
- Design Visualization
- Add Measurements
- Define SPEC STUDIES
- Review SPEC STUDIES with Visualization (Right example: CATIA 3DEXPERIENCE)
LS-DYNA IN METAL FORMING
Make Design Decisions Early to Set Parameters
Review the Spec Studies and share with colleagues to determine maximum and minimum acceptable conditions. Review design options and colors to see how these features affect the appearance of the product.
Create a 3DCS Model - Prepare Tolerance Analysis
Create a Tolerance Analysis Model to Run Simulations
Complete the Tolerance Analysis Model by adding assembly processes and production tolerances within the given design parameters determined earlier.
Process:
- Create Moves (Assembly Process)
- Modify Tolerances to Engineering Specifications
- Run Monte Carlo Simulations
Monte Carlo Simulation
Use Simulation to Make Determinations
Monte Carlo Simulation gives statistical probabilities for different variation scenarios. See how these scenario conditions affect your product’s appearance.
Just because the design allows the product to be successfully built does not mean it will look good!
Benefits:
- See the probability of different conditions based on the design
- Incorporate influence from assembly processes and engineering specifications
- Make decisions about acceptable specifications
- Share SIMULATION STUDIES with colleagues to quickly collaborate
QDM INSPECTION PLANNER
CAD Integrated Measurement Plan Creator. Convert CAD and 3DCS Points Into Measurement Plans, turn your CAD models into easy to use Measurement Plans
QDM Inspection Planner is a CATIA integrated tool for converting CAD models into interactive inspection plans. This makes it easy to correlate measurement data from the plant floor with the CAD model for problems solving and to communicate critical to quality points between engineering and manufacturing.
Value:
- Integrated Inspection Authoring – CATIA V5 and CATIA V6 3DEXPERIENCE
- Drag and drop interface for quick adoption and easy application
- Use lightweight views and different outputs to share across the organization
With integrated Measurement Plan Authoring, select the points you want to use and instantly generate forms and templates to populate for reports.

