QDM
Easy to access within each organization or supplier by centrally managing quality data collected from multiple sites
QDM Software การจัดการข้อมูลคุณภาพสูง
QDM Software การจัดการข้อมูลคุณภาพสูง จากส่วนกลาง ที่รวบรวมข้อมูลจากหลายแหล่ง ทำให้ง่ายต่อการเข้าถึงภายในแต่ละองค์กรหรือซัพพลายเออร์
Product type : engineering-solutions

QDM
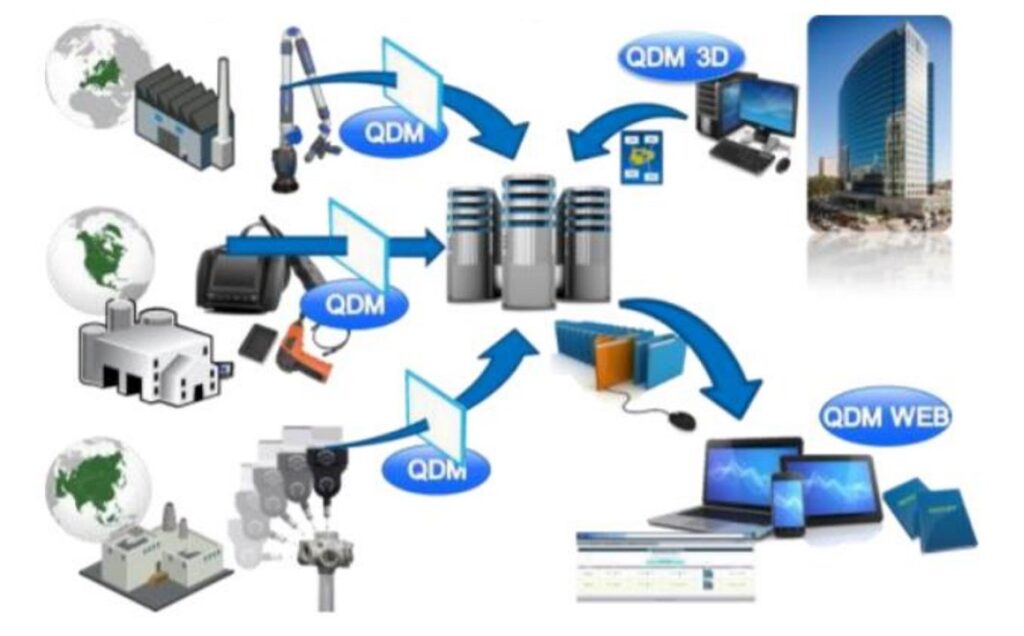
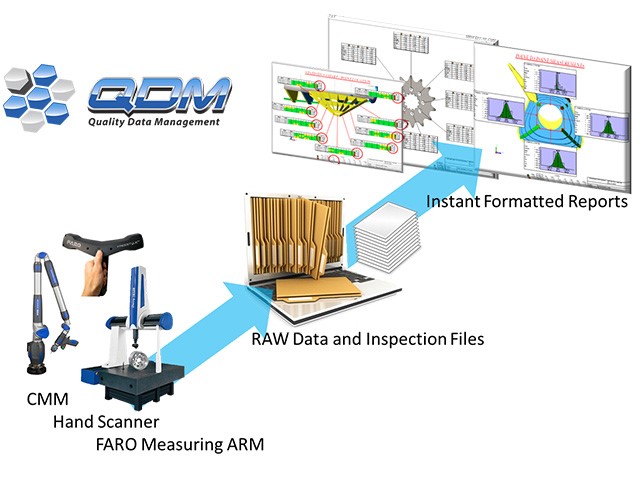
QDM Quality Data Management (QDM) makes it easy to access within each organization or supplier by centrally managing quality data collected from multiple sites, and also generates reports automatically, and automatically alerts when status deviates.
An integrated management system for quality data that improves management efficiency. By utilizing the QDM system, quality data that tends to be buried can be useful information that the entire organization can access from business management to field technicians.
FEATURES :
- Ability to customize dashboard (format) of quality data
- Ability to automate quality data processing
- Central accumulation of quality data-improving traceability
- Supports data from almost all measuring instruments in 3D measuring instruments, attribute gauges, handheld terminals and nondestructive testing etc
- Enables data management according to standards such as ISO 9000 series
- Web-based access to data from PCs, smartphones, tablets, etc.
- Easy-to-read reports including graphics and measurement data
- You can easily create and customize templates
- High versatility for various measurement devices (Datagrabber cooperation)
- Web-based high accessibility
- Refinement and extraction of highly efficient data
- Standard document output
QDM ANALYST
QDM Analyst is a powerful data analysis tool for analysing user quality data and creating graphical reports, making it easy for users to understand data.
FEATURES :
- Create FAIR, Ppap and Quality Reports in Seconds
- Measurement data from any source can be used
- Generate quality metrics, compare data and visualize product quality
- QDM Analyst can load CAD drawings and associate with current information
INDEX
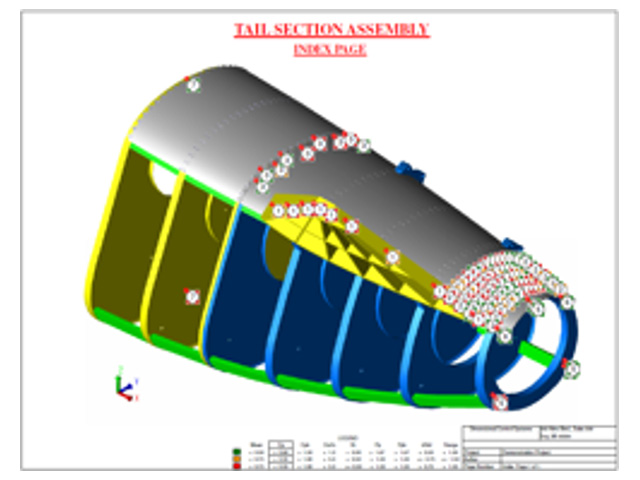
The performance of the index of each point is evaluated by colour coding to show whether it is pass/fail. The number is the page where the detailed report for that point is located.
STATISTICS CHARTS - CPK
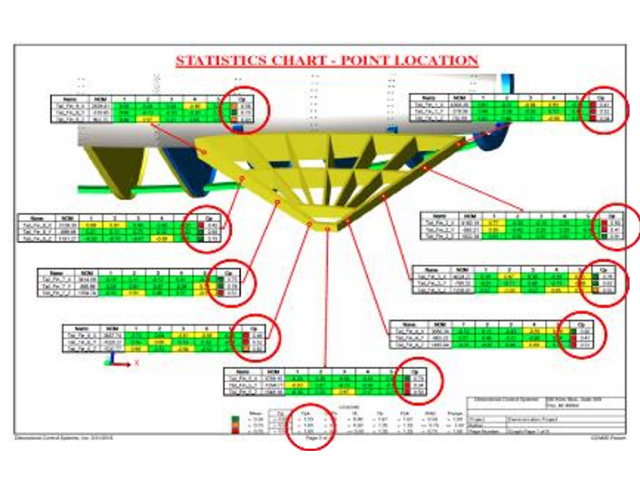
Quickly calculate statistical indicators and add criteria for passing/nonqualifying
POINT TO POINT MEASUREMENTS
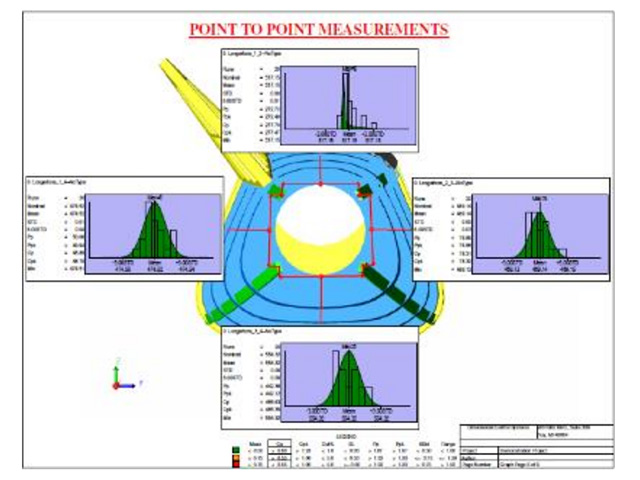
See the distribution of all of your point-to-point measurements, referenced.
SURFACE PROFILE
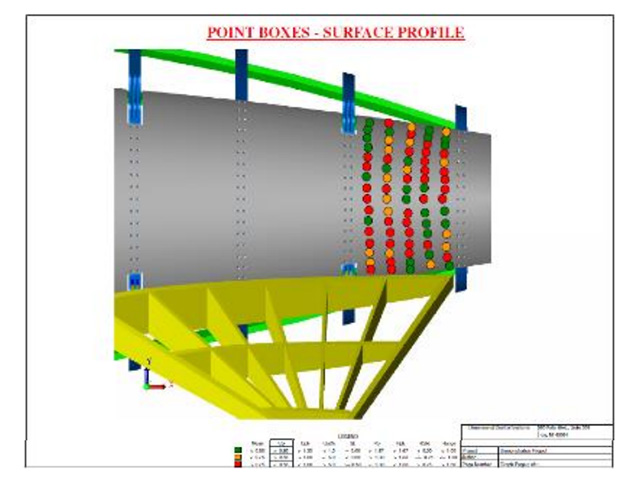
Quickly analyse with colour coding, set the pass/fail conditions, and display the variation of surface profile deviation.
RUN CHART
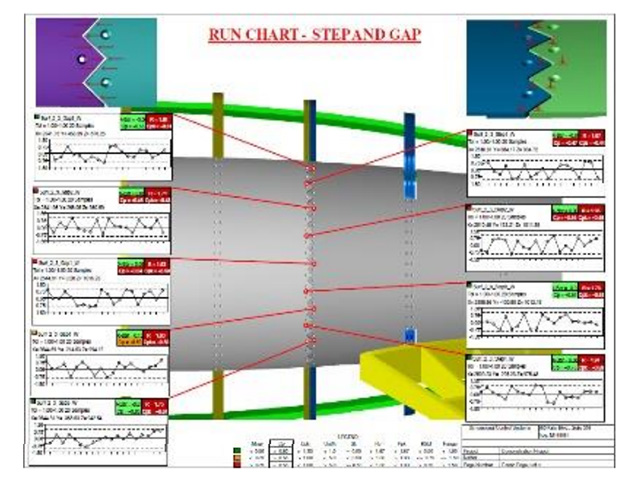
Continuous tracking of the last measured data and comparison of past products
COLOUR MAPPING
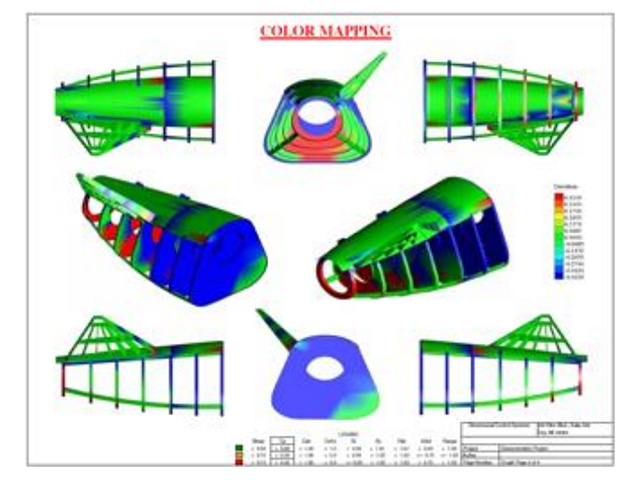
Colour Mapping Highlight trouble areas and present findings visually to managers and team members
SUMMARY CHART
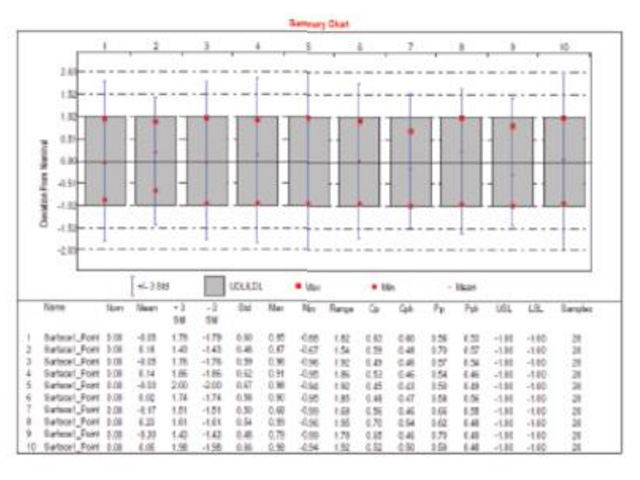
All relevant data is displayed in an easyto-read form for quick inspection and communication with quality experts.
QDM PDA
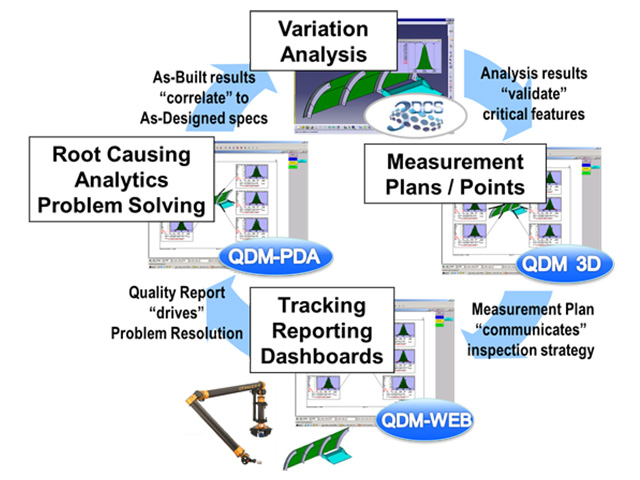
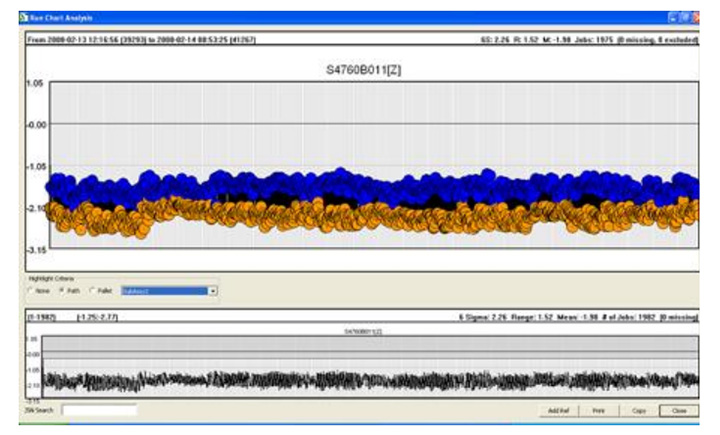
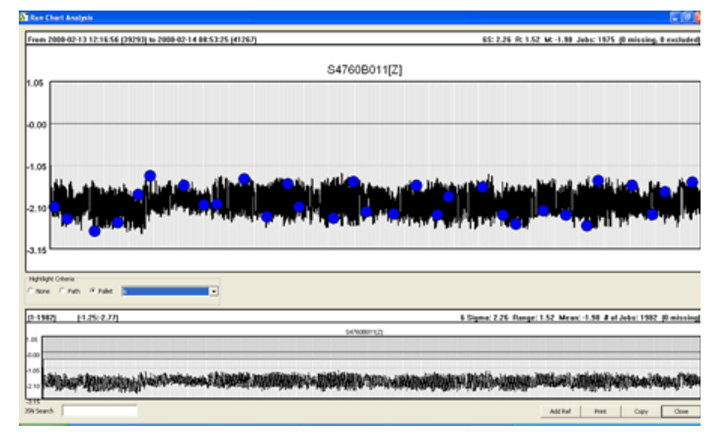
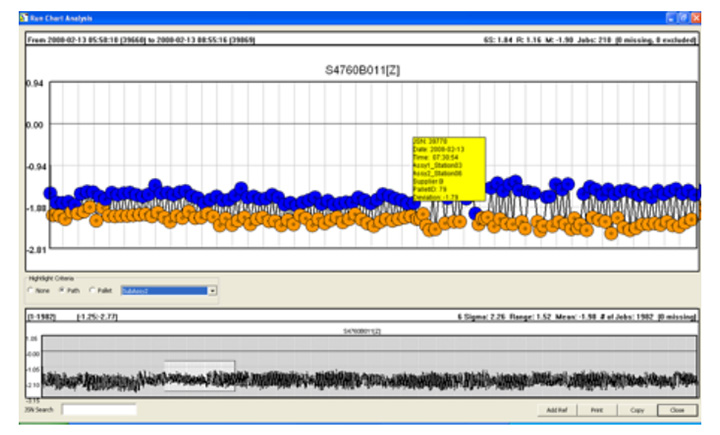
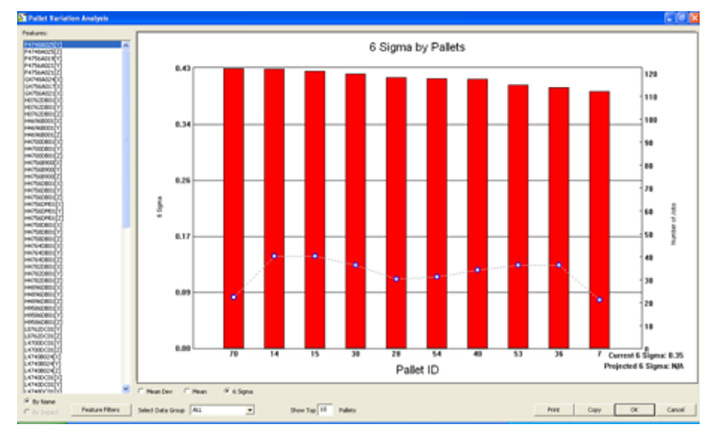
QDM PDA is an advanced analysis tool for diving deep into your data. It gives you the ability to answer important questions about your product quality. Leverage the answers to make decisions about process changes, suppliers and tooling.
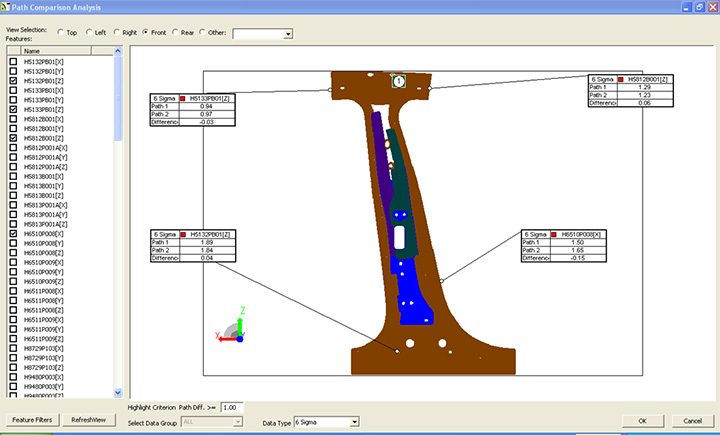
Features:
- Real-time analysis of plant data
- Root cause analysis identify variation cause by specific influences.
- Analyze Specific Trends
- Make determinations about changes in suppliers, machines and process
- Graphical data monitoring
- Component moves in a certain range of motion in the direction of unconstrained degrees of freedom
- Can calculate simulation results at multiple motion positions
QDM GATEWAY
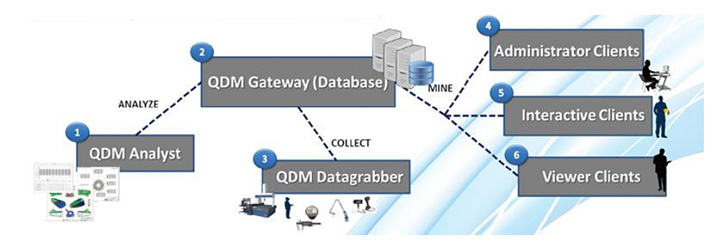
QDM Gateway is the core component of a QDM System. Installed either locally on a server or through the cloud, the QDM Gateway is the database repository of all of your information, standardized into a single format for easy access and use.
As part of a basic QDM Systemthe QDM Gateway connects all of the QDM Modules together, and allows user to automate processes to save time and get the information needed.
Features:
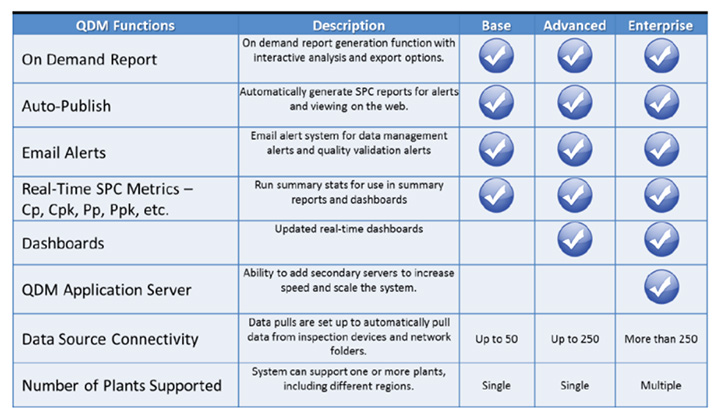
- Create enterprise wide quality collaboration
- Use the cloud for fast deployment
- Add or remove clients and modules to scale system
QDM INSPECTION PLANNER
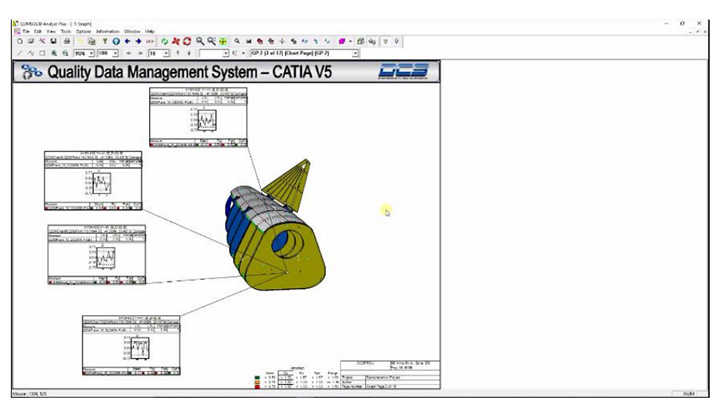
QDM Inspection Planner is a CATIA integrated tool for convert CAD and 3DCS points into measurement plans.
This makes it easy to correlate measurement data from the plant floor with the CAD model for problems solving and to communicate critical to quality points between engineering and manufacturing.
Features:
- Use existing CATIA models
- Use to connect CAD and plant data
- Correlate design and measurement plans
QDM DATAGRABBER
QDM Datagrabber is a support module for the QDM System.
Datagrabber automatically collects and uploads measurement and quality data as it becomes available, keeping your QDM System updated in real time.

Features:
- Automatically upload measurement data
- Bring in inspection device data or Excel sheets
- Connect multiple plants or suppliers
QDM SATELLITE STATION
Satellite Stations update in real time with measured data from the shop floor or inspection data
This informs your team of minute to minute changes in quality and allows them to react instantly to possible quality issues.

Features:
- See real time quality reports
- Instantly dive into the data
- Add displays to different areas of business
QDM DATA ENTRY PORTAL
Data Entry Portal is a dedicated input station for your QDM System to input manual measurements

Features:
- Keep Quality System updated from hand measurements and Excel
- Easy interface makes updating dashboard and reports quick and easy
- Create stations right on the plant floor or through a portable device
QDM 3D TEMPLATE MAKER
Similar to QDM ANALYST, QDM 3D Template Maker uses raw data or data from a QDM System to populate templates and forms to instantly create new reports.
It is also used to create new templates and forms with easy drag and drop interfaces.

Features:
- Create a report once, use it a thousand times with new data
- Use data from any CAD or measurement system
- Use CAD or images to add context to reports
Facebook : SPJS Engineering (Thailand)


